
Laser beam divergence and spot size
Procedure
Performing the real lab
- Arrange the laser and detector in an optical bench arrangement.
- The laser is switched on and is made to incident on the photodiode.
- Fix the distance, z between the detector and the laser source.
- By adjusting the micrometer of the detector, move the spot in the horizontal direction, from left to right.
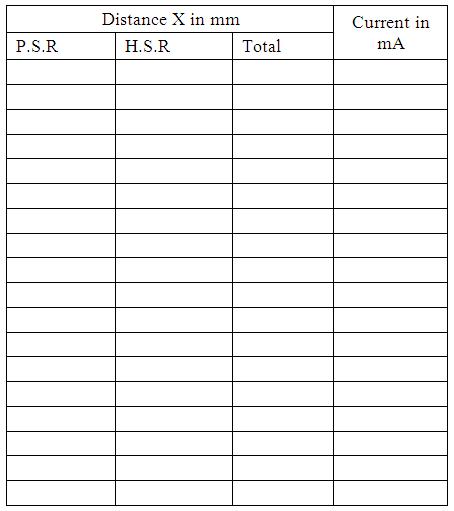
- Note the output current for each distance, x from the measuring device.
- Then the beam profile is plotted with the micrometer distance along the X-axis and intensity of current along Y-axis. We will get a gaussian curve (see Fig.1).
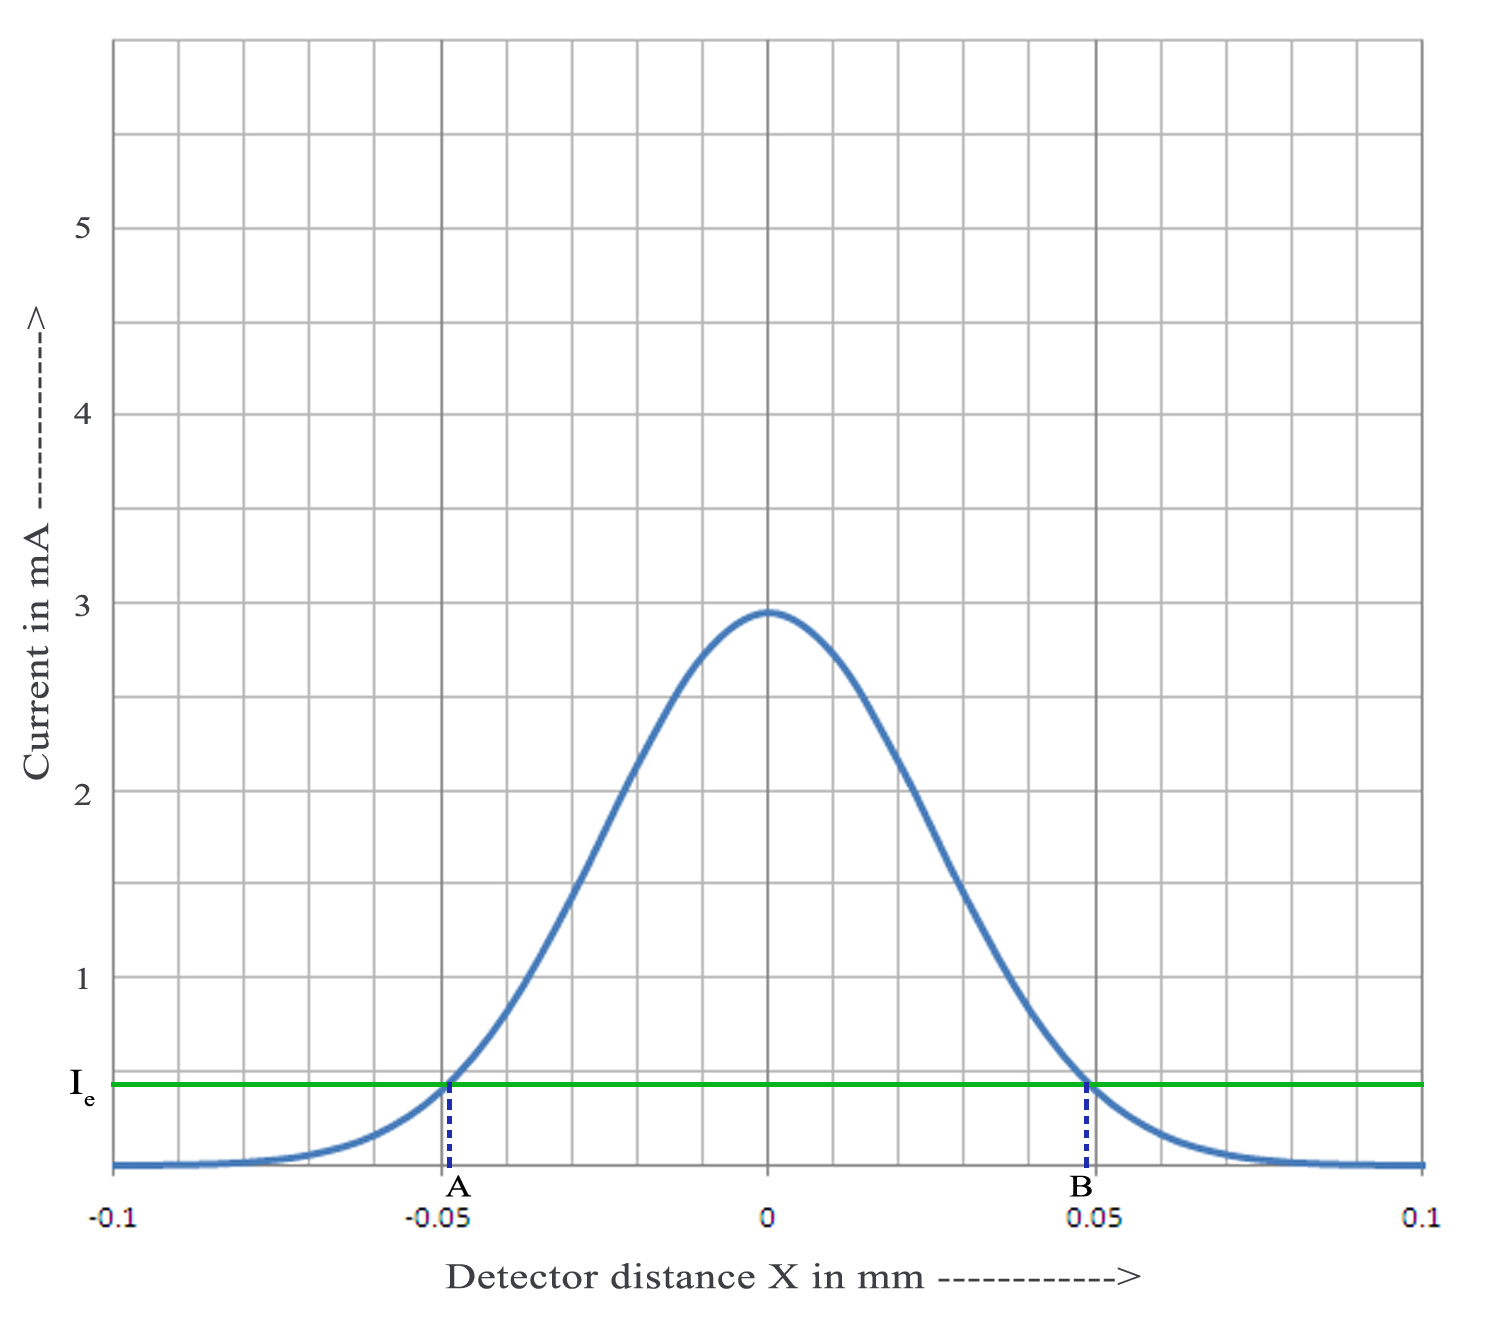
Figure 1: beam profile of Laser beam divergence.
- The experiment is repeated for different detector distances.
- Note the points in the graph where the intensity equals of the maximum intensity, say it as (see Fig.1).
- Find the micrometer distance across the beam corresponding to these points ( B-A from the Fig.1) for a pair of detector distances and . Half of this distance is noted as and .
- Then the divergence and spot size of the laser beam can be calculated from the equations.
Observation and calculation
To find the Least Count of Screw gauge
One pitchscale division ( n) = .............. mm
Number of divisions on head scale (m) = ...............
Least Count (L.C) = n/m = ......................
= ....................... cm
= ................ cm
 |
 |
|
1/e2 of maximum intensity,Ie =................ mA Diameter of the beam corresponds to Ie, d1= ..................mm |
1/e2 of maximum intensity,Ie =................ mA Diameter of the beam corresponds to Ie, d2= ..................mm |
Divergence angle = = .................. m rad
Performing the simulator
- The experimental arrangement is shown in the simulator. A side view and top view of the set up is given in the inset.
- The start button enables the user to start the experiment.
- From the combo box, select the desired laser source.
- Then fix a detector distance, say 100 cm, using the slider Detector distance, z.
- The z distance can be varied from 50 cm to 200 cm.
- For a particular z distance, change the detector distance x, from minimum to maximum, using the slider Detector distance, x. The micrometer distances and the corresponding output currents are noted. The x distances can be read from the zoomed view of the micrometer and the current can be note from the digital display of the output device.
- Draw the graph and calculate the beam divergence and spot size using the steps given above.
- Show graph button enables the user to view the beam profile.
- Using the option Show result, one can verify the result obtained after doing the experiment.